AWS Crypto ETL Pipeline
What this project is
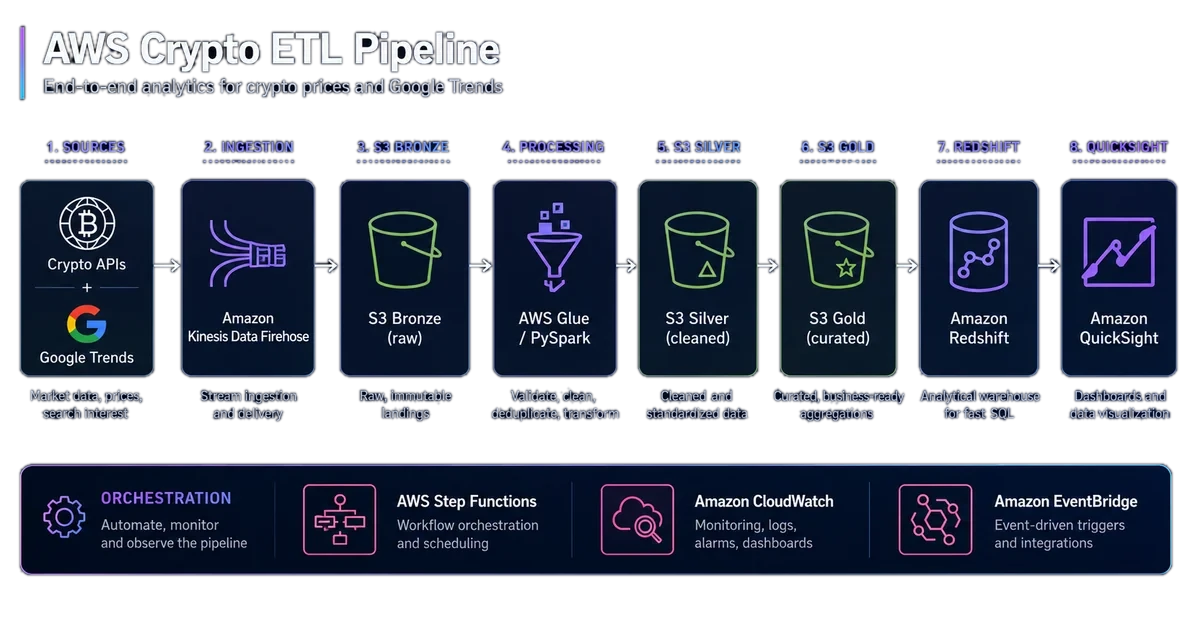
AWS Crypto ETL Pipeline is an end-to-end data engineering pipeline that moves crypto and Google Trends data from CSV files into an analytical dataset queryable in Redshift Serverless. The project demonstrates a complete cloud workflow: ingestion on S3, PySpark transformations with AWS Glue, orchestration with Step Functions, and visualization through QuickSight.
Technical context
The project starts from a typical Data Engineering need: turning heterogeneous datasets with different granularities into a single, clean, queryable data flow.
In this case, the source data consists of historical Bitcoin and Monero prices at daily granularity, together with Google Trends indexes for the same assets at weekly granularity. Without a structured pipeline, these datasets remain hard to compare: different formats, different time frequencies, and manual steps make the analysis difficult to reproduce.
The goal was to build a cloud-native pipeline able to ingest, transform, validate, and make the data available in a data warehouse for later analysis.
Goal
The goal of the project was to build an end-to-end ETL pipeline on AWS covering the full data lifecycle:
loading CSV files into a raw layer on S3;
preprocessing and normalization with AWS Glue and PySpark;
creation of a silver layer in Parquet format;
construction of a unified gold layer;
final loading into Redshift Serverless;
analytical visualization through QuickSight;
job orchestration with Step Functions, retries, and error handling.
The project was not meant to be just an analysis notebook, but a small reproducible and observable data architecture close to a real-world workflow.
Architecture
The pipeline follows a layered structure:
Local CSV files are uploaded to S3 through a Python script using boto3.
The S3 raw layer acts as the landing area for the original data.
AWS Glue Job T1 performs cleaning, date conversion, numeric casting, and Parquet output.
The S3 silver layer stores clean and compressed data.
AWS Glue Job T2 performs joins, forward fill, moving average calculation, and BTC/XMR unification.
The S3 gold layer stores the final dataset ready for the data warehouse.
An AWS Glue Load Job loads the data into Redshift Serverless through JDBC/IAM.
QuickSight provides the visualization layer.
The Glue jobs are orchestrated sequentially by AWS Step Functions. Each step includes automatic retries, exponential backoff, and error handling toward a fail state.
Dataset
The pipeline works with four sources:
historical Bitcoin prices at daily granularity;
historical Monero prices at daily granularity;
Google Trends data for the keyword "bitcoin" at weekly granularity;
Google Trends data for the keyword "Monero" at weekly granularity.
The main challenge was not only cleaning the data, but making it comparable over time. For this reason, weekly Google Trends values are aligned to daily dates through a forward fill implemented with window functions.
Technical Choices
Why AWS Glue and PySpark
AWS Glue makes it possible to run distributed transformations without managing servers or clusters directly. Even though the project dataset is relatively small, the choice is useful for simulating a realistic pattern: ingestion on S3, PySpark transformations, Parquet output, and loading into a warehouse.
PySpark was used to handle typical data engineering transformations: type normalization, window functions, joins across datasets with different granularities, and creation of a unified final schema.
Why S3 raw, silver, and gold layers
The separation into layers makes the pipeline more readable and maintainable:
raw preserves the original data;
silver contains clean and standardized data;
gold exposes the final dataset ready for analytics and dashboards.
This structure preserves traceability and makes it possible to rerun or fix individual steps without mixing raw data with transformed data.
Why Parquet
Parquet was chosen for the intermediate layer because it is columnar, compressed, and well suited to analytical workloads. In a data pipeline, it is preferable to CSV when data needs to be read multiple times by different jobs or loaded into analytical systems.
Why Step Functions
Step Functions was used to orchestrate the Glue job sequence. The main advantage is separating orchestration logic from transformation logic: jobs handle the data, while the state machine manages order, retries, backoff, and errors.
Design Reasoning
The central point of the project was designing a pipeline that is readable, not only functional.
The first decision was to split transformations into multiple steps instead of concentrating all logic in a single script. This makes it easier to understand the role of each job:
T1 prepares clean and consistent data;
T2 creates analytical features and unifies the assets;
Load moves the final dataset into the warehouse.
Another important decision was to separate the loading job from the transformation job. The Load.py job reads the gold dataset, orders it by date and crypto symbol, and writes it to Redshift through JDBC/IAM. This keeps the warehouse loading step isolated from the cleaning and unification logic.
The most interesting transformation is the alignment between daily and weekly time series. Google Trends data does not have the same frequency as crypto prices, so a forward fill was required to propagate the weekly value across the following days until the next available value.
Results
The pipeline produces a final public.crypto_analysis table on Redshift with:
crypto symbol;
date;
transformed price with a 10-day moving average;
temporally aligned Google Trends index.
The documented performance is:
T1 preprocessing: about 128 seconds;
T2 unification: about 118 seconds;
Redshift load: about 296 seconds;
total pipeline runtime: about 9 minutes.
The project also includes an estimate of monthly AWS costs, with a limited cost profile across Glue, Step Functions, S3, Redshift Serverless, and QuickSight.
Technical FAQ
Why did you use AWS Glue instead of a local Python script?
I chose AWS Glue to bring the project closer to a realistic data engineering context: distributed transformations, native S3 integration, serverless execution, and orchestration with Step Functions. A local Python script would have been simpler, but it would have shown less of the architectural reasoning.
What are the raw, silver, and gold layers for?
I used them to separate the stages of the data lifecycle. In the raw layer I keep the original data, in the silver layer I prepare clean and standardized data, while in the gold layer I expose the final dataset ready for analysis and Redshift loading.
Why does Google Trends require forward fill?
Because Google Trends is available at weekly granularity, while crypto prices are daily. I used forward fill to align the weekly value to the intermediate days until the next available value, avoiding gaps in the final dataset.
Why use Redshift Serverless?
I used Redshift Serverless to expose the final dataset in an analytical data warehouse without directly managing provisioned clusters. I wanted to arrive at a SQL-queryable structure ready for QuickSight.
What makes this project useful for a Data Engineering portfolio?